XrViz: An interactive visualisation interface for Xarrays
✻
XrViz is an interactive, in browser visualisation interface for Xarrays backed by the full power of the Python ecosystem. It allows controlled data points selection, massive rendering, data display, custom interaction and selection of fields for plotting in the browser using Intake, Xarray and PyViz (now HoloViz) collection of tools. It holds the promise of saving Earth Science and other researchers significant amounts of time since they can directly focus on visual data analysis and research rather than writing custom code to explore data.
Here is the project repository.
As of now it has 3 panels:
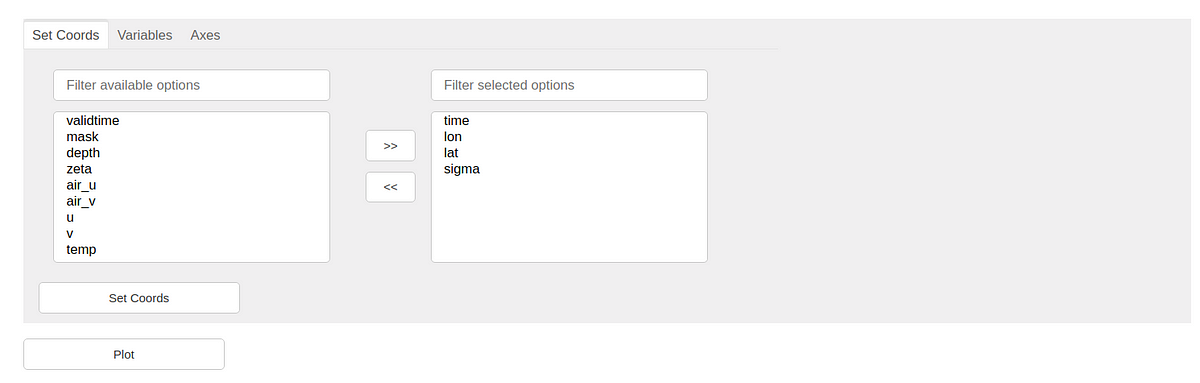
This panel allows the user to set/reset the coordinates.

This panel allows the user to select a variable for plotting and have a look at its properties or attributes.

This panel allows the user to select the axis along which to create a plot. It also allows to select aggregations to apply to remaining dimensions. In case you do not need to apply any aggregation, you can create a Selector or Animation widget for a dimension.
These are some of the upcoming features:
1. This interface is built in Python which has become one of the most pervasive programming languages in the scientific community. Hence this interface could be easily extended by the researchers.
2. It is being developed in open source, so anyone can share their ideas, contribute to the code or request new features. Open source environment will also ensure that the interface keeps becoming better, stronger, well tested with time as community uses it.
3. It will have the capability to handle large scale datasets and data stored on cloud. Parallel computation and memory management could be taken care of by using it in conjunction with tools like Dask.
4. Better user interface and much more functionality as compared to other such tools (Ncview, Panoply, Godiva).
5. It could be easily extended to have domain specific functionality, such as for astronomy or oceanography.
To use the interface install Xrviz using:
conda install -c conda-forge xrviz

pip install git+https://github.com/intake/xrviz --no-deps
Then run
import xarray as xr

import xrviz

from xrviz.dashboard import Dashboard


ds = xrviz.sample_data.great_lakes


dash = Dashboard(ds)

dash.show()
the following script:
This is how the interface looks:
I am working on this project in Google Summer of Code under the organisation Earth Science Information Partners (ESIP), under member organisation US Geological Survey. My mentors for this project are Rich Signell, a research oceanographer at the US Geological Survey in Woods Hole and Martin Durant, a data scientist and software engineer at Anaconda, inc.
Please stay tuned with the weekly progress reports. If you have any ideas or questions regarding this project please feel free to discuss in our Gitter channel or reach me directly.